Client project · Demand & inventory planning · 18 months of demand history
Demand Forecasting & Reorder Planning
An SKU-level forecasting and replenishment model that classifies each item by how its demand actually behaves, then sizes safety stock and reorder points to match.
Advanced Excel
- Scope
- 24 SKUs 432 demand records across 18 months (Jan 2024 – Jun 2025)
- Method
- Per-SKU forecasting selected from trend, variability and intermittency
- Finding
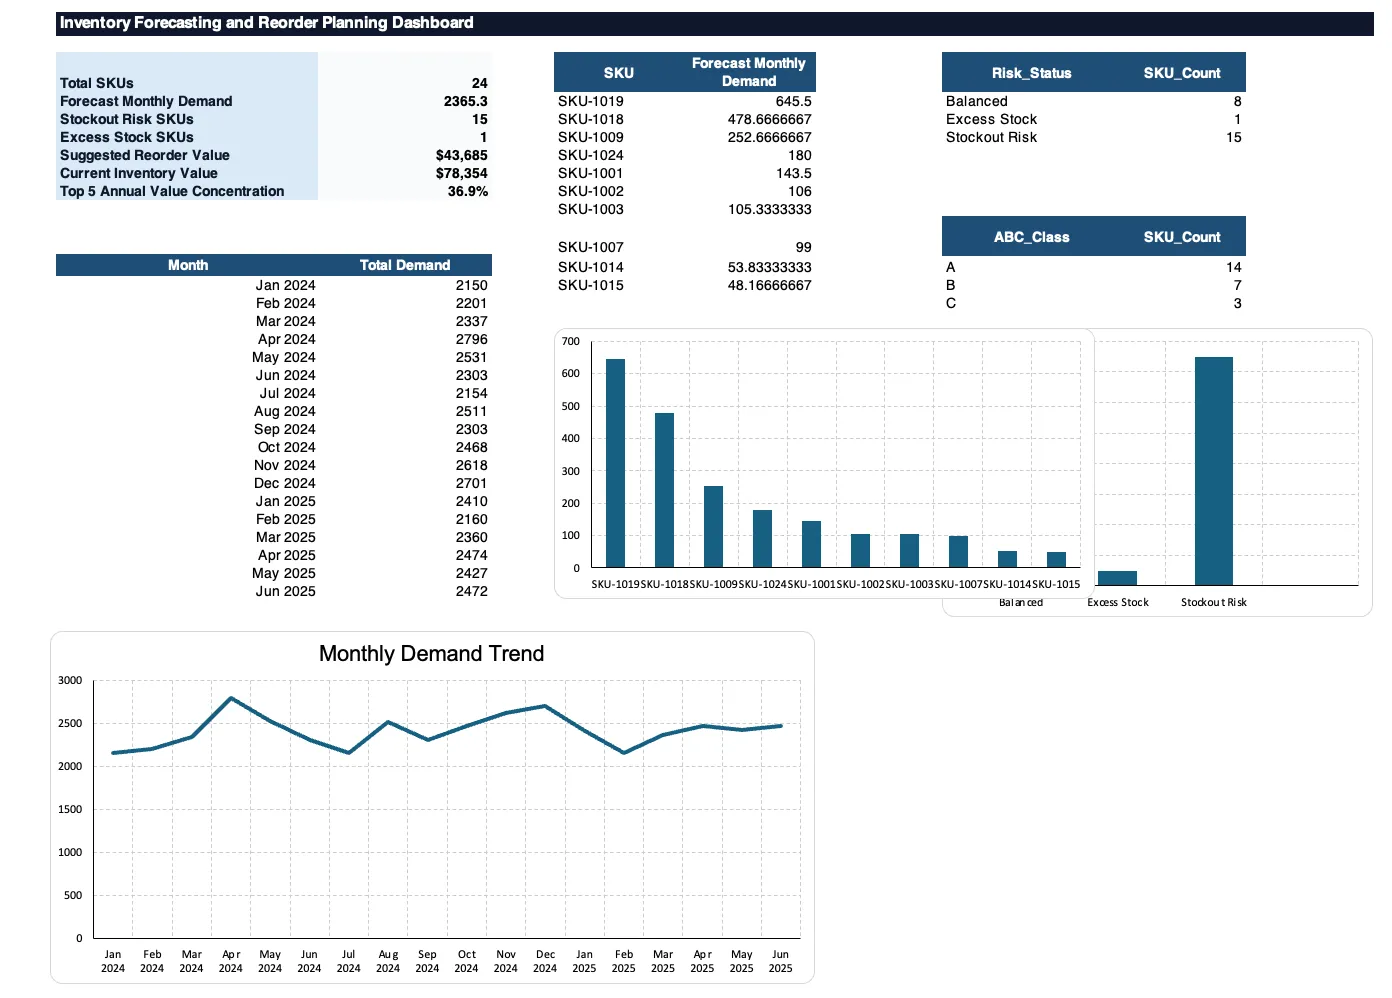
- 15 SKUs at or below reorder point
Challenge
Twenty-four SKUs spanning finished goods, components, spare parts, consumables and packaging, with 432 demand records over eighteen months. The range does not behave alike: one spare part recorded demand in six months of eighteen, while a packaging SKU moves in thousands of units against a battery module moving in tens at forty times the unit cost.
One method across that range under-stocks the intermittent items, lags the growing ones, and smooths a real decline into apparent stability.
What I did
- Classified each SKU’s demand from its own statistics — averages over three, six and twelve months, standard deviation, coefficient of variation, trend and count of zero-demand months — as stable, growing, declining, intermittent, variable or lumpy.
- Set the forecast method from that classification: six-month moving average for stable and variable items, three-month for growing ones, median-based logic for lumpy and intermittent items so occasional large orders do not inflate a baseline that is usually zero.
- Sized safety stock from a 1.65 service-level Z-score against variability scaled by the square root of lead-time days, so a long-lead item carries more cover than a short-lead item with identical variability. Reorder point is lead-time demand plus safety stock.
- Held make-to-order items back from automated reorder. Four of the 24 are MTO: modelled alongside everything else, but routed to a planner, since their demand is a customer commitment rather than a forecast.
- Gave every flag a written reason, with service level, lead times, MOQ and thresholds documented on their own sheet.
Decision
The forecast method is chosen per SKU from how its demand behaves, not applied uniformly across the range.
Key findings
- 15 SKUs at or below reorder point, several A-class finished goods, against one packaging item at 7.1 months of supply. Suggested reorder value is $43,685 against $78,354 of current inventory.
- A lowercase, trailing-space SKU variant in the raw demand file, which would have split one item into two in a live planning run.
- A purchase order past its expected receipt date, inflating on-order quantity until a buyer confirms it.
The last two are not inventory risks. They are reasons a planning run would have returned the wrong answer.
Limitations
- Service level is 1.65 across every SKU. Differentiating it by ABC class or criticality would be a reasonable next step.
- Lead times, MOQ and unit costs come from the SKU master as supplied, and were not validated against supplier agreements.
- Safety stock assumes monthly standard deviation represents variability well. That holds least for intermittent and lumpy items, which is why those use median-based forecasting.
-

Forecast_Model — Behaviour is classified from the demand statistics; the method follows from it. -

Inventory_Risk_Review — Each flag states its own reason. The last two rows are not stock risks.
Client identity is withheld. Data, screenshots and supporting artifacts are sanitized for portfolio use.